
- 28 min read

Top 10 Essential Customer Services KPI Metrics for 2026
In today's competitive landscape, exceptional customer service is no longer a luxury, it's the primary driver of loyalty and sustainable growth. But how do you quantify 'exceptional'? The answer lies in establishing a robust framework of Key Performance Indicators (KPIs). Moving beyond basic metrics like ticket volume, a modern approach to customer services kpi tracking provides a holistic view of team efficiency, customer satisfaction, and direct revenue impact. Simply measuring how quickly you respond isn't enough; you need to understand the quality of those interactions and their long-term effect on your business.
This guide is designed to be your definitive resource for mastering customer support analytics. We will explore the 10 most crucial KPIs that every customer-centric business must track. You won't find generic advice here. Instead, you'll get a practical breakdown for each metric, including:
- Clear definitions and step-by-step formulas.
- Actionable strategies to improve your scores.
- Industry-standard benchmarks to aim for.
- Practical examples of how tools like ForumScout can uncover these insights in real-time conversations across social media, forums, and communities.
By the end of this article, you will have a clear blueprint for measuring what truly matters. We'll equip you with the knowledge to analyse everything from initial contact to long-term loyalty, enabling you to transform your support team from a necessary cost centre into a powerful, data-driven engine for business growth and customer retention. Let's dive in.
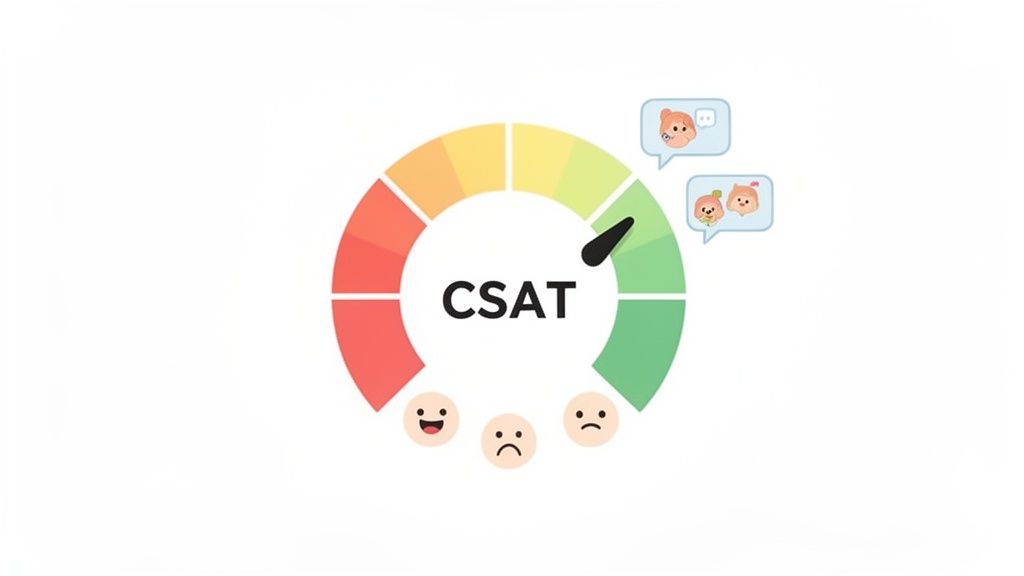
1. Customer Satisfaction Score (CSAT)
The Customer Satisfaction Score (CSAT) is a foundational customer services KPI that measures how satisfied a customer is with a specific interaction, product, or service. It directly answers the question, "How satisfied were you with your recent experience?" by asking customers to rate their satisfaction on a scale, typically from 1 (very unsatisfied) to 5 (very satisfied). This metric provides an immediate, quantifiable snapshot of customer sentiment at key touchpoints.
CSAT is a crucial indicator because it provides direct feedback on individual interactions, allowing you to pinpoint successes and failures within the customer journey. For example, an e-commerce brand can send a post-delivery survey to gauge satisfaction with the shipping process, or a software company can trigger a CSAT question after closing a support ticket.
How to Calculate and Use CSAT
The formula for CSAT is simple, making it one of the most accessible customer services KPIs to track. You calculate it by dividing the number of satisfied customers (those who rated 4 or 5) by the total number of survey responses and then multiplying the result by 100 to get a percentage.
- Formula:
(Number of Satisfied Customers / Total Number of Responses) x 100 = % Satisfied Customers - Target Benchmark: A good CSAT score is generally considered to be 75-85%. Scores above 85% are excellent, while scores below 75% indicate a need for immediate improvement.
Best Practices for Tracking CSAT
To get the most out of this metric, timing and context are everything. Surveying customers too late after an interaction can lead to inaccurate feedback.
- Keep it Brief: Limit surveys to 1-3 questions to maximise response rates.
- Monitor Unprompted Feedback: Use a tool like ForumScout to track organic mentions and sentiment shifts across forums and social media, which act as unprompted CSAT indicators. This allows you to see how customers feel without directly asking them.
- Segment Your Data: Analyse CSAT scores by channel (email, phone, social), support agent, or product line to uncover granular insights and identify specific areas for training or process improvement.
- Combine with Qualitative Data: Always include an optional open-ended question like, "How could we improve?" to understand the 'why' behind the scores.
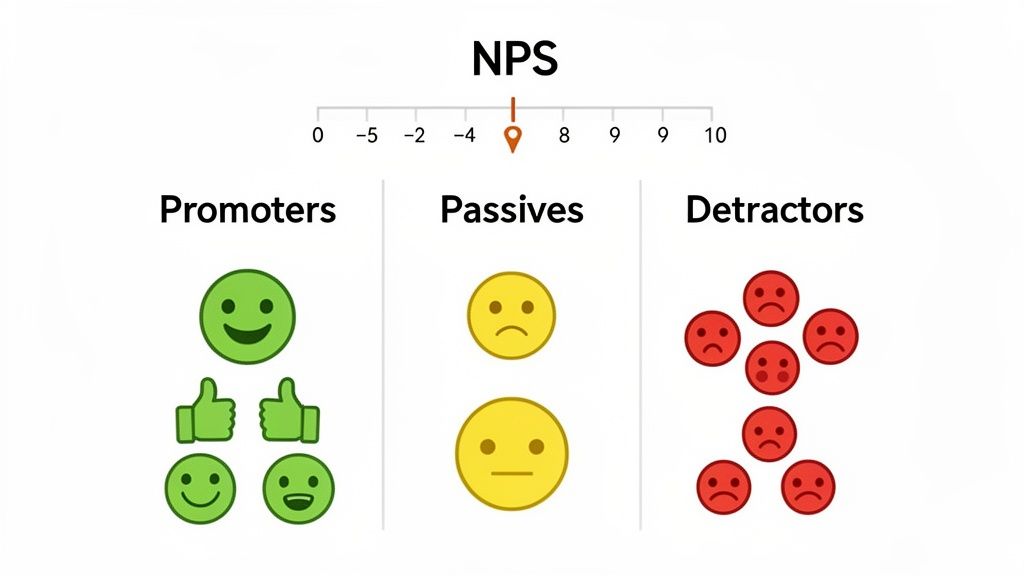
2. Net Promoter Score (NPS)
The Net Promoter Score (NPS) is a widely used customer services KPI that measures customer loyalty and their willingness to advocate for your brand. It gauges sentiment by asking one ultimate question: "On a scale of 0 to 10, how likely are you to recommend our company/product/service to a friend or colleague?" This metric, popularised by Fred Reichheld of Bain & Company, provides a high-level view of customer loyalty and predicts future business growth.
Unlike CSAT, which focuses on transactional satisfaction, NPS measures the overall relationship a customer has with your brand. A high score indicates a strong base of brand advocates, like Apple, which maintains an NPS well above 70, driving powerful word-of-mouth marketing.
How to Calculate and Use NPS
Based on their response to the 0-10 scale, customers are categorised into three groups: Promoters (9-10), Passives (7-8), and Detractors (0-6). The score is calculated by subtracting the percentage of Detractors from the percentage of Promoters, resulting in a score ranging from -100 to +100.
- Formula:
% Promoters - % Detractors = NPS Score - Target Benchmark: A score above 0 is considered good, above 50 is excellent, and above 70 is world-class. The benchmark varies significantly by industry, so it's vital to compare your score against direct competitors.
Best Practices for Tracking NPS
Effective NPS tracking is about more than just the score; it's about the actions you take based on the feedback.
- Ask a Follow-Up Question: Always include an open-ended follow-up question, such as, "What is the primary reason for your score?" to gather actionable qualitative insights.
- Track Unsolicited Loyalty Signals: Use a tool like ForumScout to monitor online conversations for phrases like "I'd recommend" or "you should try," which act as organic NPS indicators. This helps you identify Promoters and Detractors in the wild.
- Segment Your Score: Analyse your NPS by customer segment (e.g., new vs. long-term customers, product plan) to identify which parts of your user base are most and least loyal.
- Close the Loop: Create automated workflows to follow up with respondents. Thank Promoters and invite them to advocacy programmes, and immediately reach out to Detractors to resolve their issues and prevent churn.
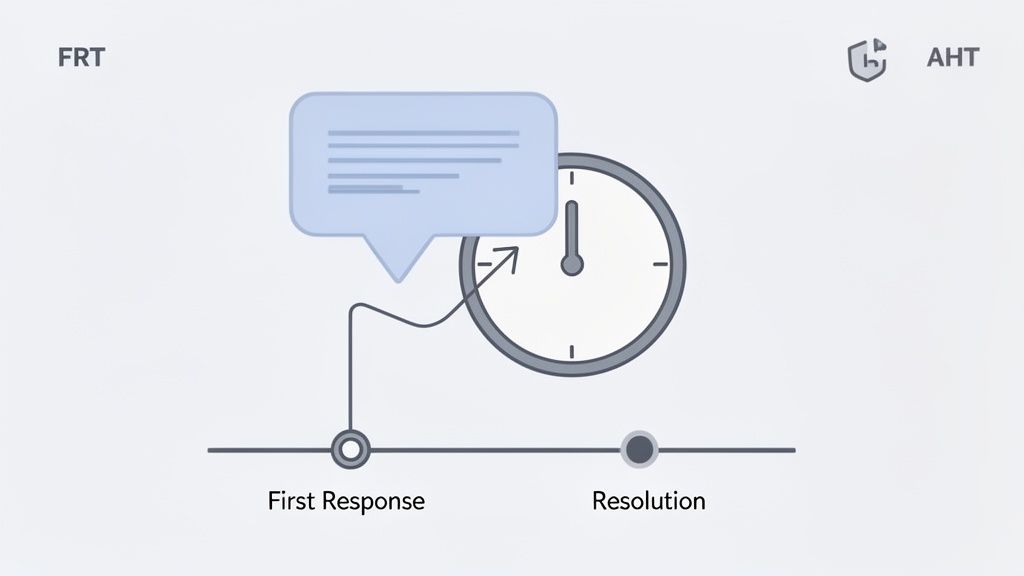
3. Response & Resolution Time (First Response Time - FRT & Average Handle Time - AHT)
This pair of customer services KPIs measures two critical aspects of your support team's efficiency: initial responsiveness and overall resolution speed. First Response Time (FRT) tracks the duration between a customer's initial contact and the first reply from a team member. In contrast, Average Resolution Time (or Average Handle Time for real-time channels) measures the total time from when a ticket is opened until the issue is fully resolved. Together, they paint a complete picture of your service velocity and effectiveness.
These metrics are essential because they directly impact customer perception and operational efficiency. A fast first response acknowledges the customer's issue and reduces frustration, which is particularly vital on social media where users expect near-instant replies. A balanced resolution time ensures that issues are solved effectively without unnecessary delays, reducing support costs and improving satisfaction. For example, SaaS companies maintaining an FRT under one hour often see a 25% improvement in customer retention.
How to Calculate and Use FRT & Resolution Time
Calculating these KPIs involves tracking timestamps from the moment a customer query arrives to its final resolution. For a detailed exploration of key resolution time metrics, a guide on mastering Average Handle Time (AHT) can provide valuable insights into operational efficiency.
- Formula (FRT):
(Sum of All First Response Times) / (Total Number of Tickets Responded To) - Formula (Avg. Resolution Time):
(Total Time Taken to Resolve All Tickets) / (Total Number of Resolved Tickets) - Target Benchmark: Aim for an FRT of 1-2 hours on social media and 4-8 hours for email. Resolution times vary by complexity, with benchmarks ranging from 15-45 minutes for IT helpdesk issues to 24-48 hours for complex e-commerce queries.
Best Practices for Tracking Response & Resolution Time
Improving these metrics requires a balance between speed and quality. Rushing to close a ticket can lead to poor outcomes and repeat contacts.
- Set Channel-Specific Targets: Recognise that customer expectations differ across platforms. Set aggressive FRT goals for real-time channels like social media and live chat, and more lenient targets for email.
- Prioritise Urgent Mentions: Use a tool like ForumScout to set up alerts for urgent keywords (e.g., "broken," "scam," "angry"). This allows your team to prioritise and respond to high-stakes social media mentions in under an hour.
- Balance Speed with Quality: Never sacrifice the quality of a resolution for the sake of a faster time. Track CSAT alongside FRT and resolution time to ensure that quick responses are also effective ones.
- Leverage Templates and Automation: Use automated acknowledgement replies to manage FRT expectations while a human agent gathers context. Equip your team with response templates and a robust knowledge base to accelerate accurate resolutions.
4. Customer Effort Score (CES)
The Customer Effort Score (CES) is a powerful customer services KPI designed to measure the ease of a customer's experience. Instead of asking about satisfaction, CES directly addresses the amount of effort a customer had to exert to get a query resolved, a purchase made, or a question answered. It operates on the principle that loyalty is driven more by making things easy for customers than by delighting them. Research popularised by Gartner shows that customers who report low-effort interactions have a significantly higher likelihood of repurchasing.
This metric is vital because it shifts the focus from a single moment of satisfaction to the overall efficiency of your processes. A high-effort experience, such as being transferred between multiple agents or having to repeat information, is a major driver of customer disloyalty. For example, a bank that simplifies its online portal to reduce customer effort can see a direct, positive impact on customer retention rates.
How to Calculate and Use CES
CES is typically measured by asking a direct question like, "To what extent do you agree or disagree with the following statement: The company made it easy for me to handle my issue?" The response is captured on a scale, often from 1 (Strongly Disagree) to 7 (Strongly Agree). The score is the average of all responses.
- Formula:
Sum of all CES Scores / Total Number of Responses = CES - Target Benchmark: On a 7-point scale, a good CES score is generally considered to be 5.0 or higher. Scores below 5.0 suggest that customers are facing unnecessary friction and that processes need urgent review.
Best Practices for Tracking CES
To effectively leverage CES, you must ask the question at the right time and act on the feedback you receive. The goal is to identify and eliminate points of friction in the customer journey.
- Time it Right: Deploy the CES survey immediately after a key interaction, such as the closing of a support ticket or the completion of a purchase, while the experience is still fresh.
- Monitor Unprompted Effort Signals: Use a tool like ForumScout to listen for language indicating high effort in public forums and on social media. Phrases like "finally got it sorted," "after three phone calls," or "stuck in a loop" are clear, unprompted indicators of high customer effort.
- Segment by Interaction: Analyse CES scores based on the type of issue, the channel used, or even the specific agent involved. This helps you pinpoint exactly where your processes are creating unnecessary work for customers.
- Follow Up on Low Scores: Implement a process to follow up on low CES scores with an open-ended question like, "What made this experience difficult for you?" This provides the qualitative context needed to make targeted improvements.
5. Response Rate
The Response Rate is a vital customer services KPI that measures the percentage of customer inquiries that receive a reply from your team. Unlike metrics focused on speed, such as First Response Time, this KPI's primary goal is to ensure that no customer is ignored. It answers the fundamental question, "Are we acknowledging every customer who reaches out?" and is crucial for building trust and maintaining engagement.
This metric is a direct indicator of your team's attentiveness and commitment to its customer base. A low response rate signals that messages are falling through the cracks, leading to frustrated customers who feel unheard. For example, a brand with a 99% response rate on its social media channels demonstrates reliability, whereas a brand with a 70% rate appears disorganised and uncommunicative, damaging its reputation.
How to Calculate and Use Response Rate
Calculating the Response Rate is straightforward, making it an easy-to-implement customer services KPI for any support team. You divide the number of inquiries that received a response by the total number of inquiries received over a specific period, then multiply by 100 to get a percentage.
- Formula:
(Number of Inquiries Responded To / Total Number of Inquiries) x 100 = % Response Rate - Target Benchmark: A strong Response Rate is typically 95% or higher across all channels. For real-time channels like live chat, the expectation is closer to 99%, while email support should aim for at least 98%.
Best Practices for Tracking Response Rate
Achieving a high response rate requires a systematic approach to managing incoming communications and clear team guidelines.
- Define What a 'Response' Is: Train your team that a proper response isn't just a simple "got it". It should be a meaningful acknowledgement that confirms receipt and outlines the next steps or resolution time.
- Set Channel-Specific Targets: Acknowledge that customer expectations vary. Aim for 95%+ on social media, 98%+ for email, and 99%+ for live chat during business hours.
- Automate Where Possible: Use automated routing rules to assign incoming messages to the correct agent or department instantly, reducing the risk of an inquiry being missed. Implement out-of-office notifications to manage expectations during off-hours.
- Monitor Unseen Conversations: Customer inquiries don’t just happen in your official support channels. Use a tool like ForumScout to receive smart notifications for urgent mentions on platforms like Reddit, ensuring you can respond to critical conversations you might otherwise miss.
6. First Contact Resolution (FCR)
First Contact Resolution (FCR), often called First Call Resolution, is a critical customer services KPI that measures the percentage of customer queries resolved entirely within the first interaction. This means the customer does not need to call back, send a follow-up email, or start a new chat session for the same issue. It is a powerful indicator of both operational efficiency and customer satisfaction, as it reflects the knowledge and empowerment of your support team.
A high FCR rate is a strong signal of a well-organised support system with streamlined processes. For customers, it means their problems are solved quickly and without extra effort, leading to a much better experience. For the business, it reduces the cost per ticket and frees up agent time to handle new enquiries. For instance, many IT support departments have found that improving FCR from 65% to over 80% can reduce their cost per ticket by more than 30%.
How to Calculate and Use FCR
Calculating FCR is straightforward, focusing on the ratio of single-contact resolutions to the total number of unique enquiries. The key is to have a clear, internally agreed-upon definition of what "resolved" means for your organisation.
- Formula:
(Total Number of Issues Resolved on First Contact / Total Number of Unique Issues) x 100 = % FCR - Target Benchmark: A good FCR rate is generally 70-79%, with world-class support organisations like Apple and Zappos consistently achieving 80% or higher.
Best Practices for Tracking FCR
Effective FCR tracking requires clear definitions and the right tools to empower your team. The goal is to solve the issue correctly the first time, not just close the ticket quickly.
- Define "Resolved": Establish a clear, company-wide definition of what constitutes a resolved issue. Does it mean the agent believes it's solved, or does it require customer confirmation? This prevents inconsistent data.
- Empower Your Frontline: Give agents the authority and resources, such as a robust knowledge base, to solve common problems without needing to escalate or seek approval.
- Track by Channel and Topic: Analyse FCR by support channel (phone, email, social media) and issue type. This helps identify complex topics that may require better documentation or agent training.
- Monitor Social Resolutions: Use a tool like ForumScout to track public conversations on platforms like Reddit. Identifying threads where a single official response solves a user's problem provides an unprompted view of your FCR performance in public forums.
7. Customer Retention Rate
Customer Retention Rate (CRR) measures the percentage of customers a business keeps over a specific period. This powerful customer services KPI reveals how well your service, product, and overall experience meet customer expectations, directly impacting long-term profitability. It answers the critical question, "Are our customers staying with us?" and is a strong indicator of customer loyalty and satisfaction.
CRR is a vital metric because retaining an existing customer is significantly more cost-effective than acquiring a new one. High retention rates often correlate with higher customer lifetime value, stable revenue streams, and a strong brand reputation. For subscription-based businesses like SaaS or e-commerce brands with repeat buyers, a small increase in retention can lead to substantial profit growth.
How to Calculate and Use CRR
The calculation for Customer Retention Rate is straightforward and provides a clear view of your company's ability to maintain its customer base over time. You measure it by comparing the number of customers at the start and end of a period, after accounting for new customer acquisitions.
- Formula:
[ (Customers at End of Period - New Customers Acquired) / Customers at Start of Period ] x 100 = % Retention Rate - Target Benchmark: A good CRR varies by industry. Enterprise SaaS companies often aim for 90%+, while e-commerce might see 60% as excellent. The key is to establish a baseline and strive for consistent improvement.
Best Practices for Tracking CRR
Effective CRR tracking requires a proactive approach to understanding and improving the customer experience. Merely calculating the number is not enough; you must act on the insights it provides.
- Segment Your Data: Analyse retention by customer cohorts (e.g., those who signed up in the same month), product line, or acquisition channel. This helps identify which customer groups are most loyal and which are at risk of churning.
- Monitor for Churn Signals: Use a tool like ForumScout to track conversations and sentiment shifts among your existing customer base online. A sudden increase in negative feedback or complaints can be a leading indicator of declining retention.
- Analyse Churned Customers: Conduct exit surveys to understand why customers leave. This qualitative data is invaluable for pinpointing specific weaknesses in your service or product. Understanding how to respond to negative feedback is crucial to preventing further churn.
- Correlate with Initiatives: Tie changes in your retention rate to specific customer service improvements, onboarding programmes, or product updates to measure their direct impact on loyalty.
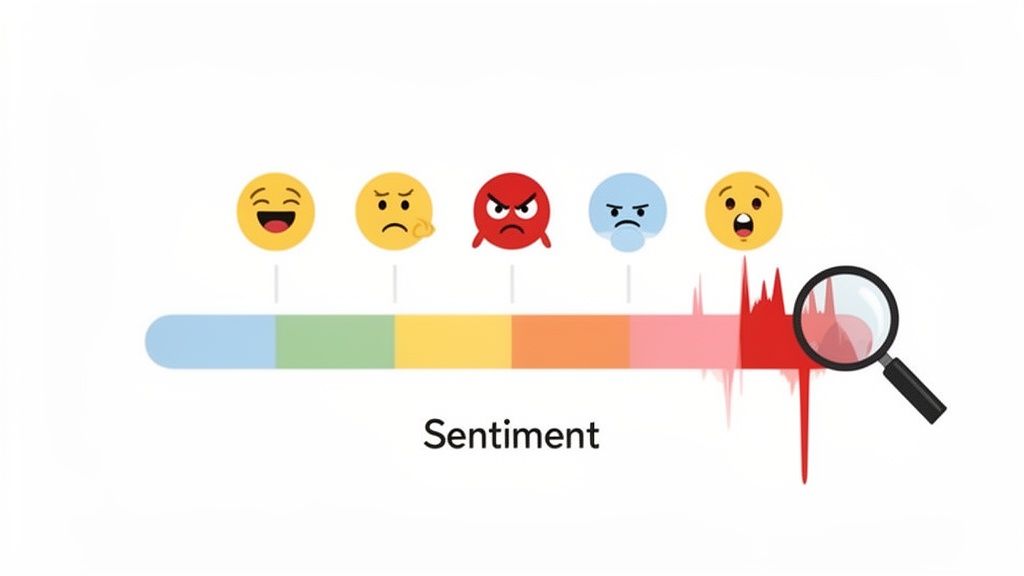
8. Customer Sentiment Analysis & Emotional Tone
Customer Sentiment Analysis goes beyond simple scores by measuring the emotional tone of customer feedback across various channels. This qualitative customer services KPI automatically categorises text-based interactions as positive, negative, or neutral. More advanced systems can even detect specific emotions like joy, anger, or frustration, providing a deeper understanding of the customer's state of mind. It allows teams to gauge the overall feeling towards their brand, products, or service without direct surveys.
This metric is vital for proactive reputation management and identifying simmering issues before they escalate. For instance, a sudden spike in negative sentiment on social media can alert a brand to a widespread product defect or a failing marketing campaign, allowing for a swift response. By analysing the emotional undercurrent of conversations, you can prioritise outreach, route frustrated customers to senior agents, and gain unprompted insights into the customer experience.
How to Calculate and Use Sentiment Analysis
Sentiment is typically calculated using Natural Language Processing (NLP) algorithms that analyse text and assign a score. The output is usually presented as a percentage breakdown of positive, negative, and neutral mentions over a given period.
- Formula:
(Number of Positive Mentions / Total Number of Mentions) x 100 = % Positive Sentiment(The same formula applies to negative and neutral mentions). - Target Benchmark: A healthy brand should aim for a Positive Sentiment Ratio of 3:1 or 4:1 against negative sentiment. The key is less about a static number and more about monitoring trends and investigating sudden shifts.
Best Practices for Tracking Sentiment
Effective sentiment tracking requires a focus on trends and context rather than isolated comments. The goal is to understand the bigger picture of your brand's public perception.
- Establish a Baseline: Measure your average sentiment distribution over a month to understand your brand's normal emotional state. This makes it easier to spot significant deviations.
- Segment Your Data: Analyse sentiment by platform (e.g., Trustpilot vs. Twitter), product, or campaign. A product launch might generate positive sentiment on Instagram but negative sentiment in support forums.
- Utilise Automated Alerts: Tools like ForumScout can monitor sentiment across online communities and automatically alert teams when negative mentions exceed a set threshold, enabling rapid crisis intervention.
- Combine with Volume Metrics: A 10% increase in negative sentiment is more alarming when it is tied to a 200% increase in mention volume. Always analyse sentiment in context. For a deeper dive, you can learn more about sentiment analysis for social media and how to apply it effectively.
9. Share of Voice (SOV) & Competitive Sentiment
Share of Voice (SOV) is a powerful customer services KPI that moves beyond your own brand to measure your visibility within the broader market. It quantifies your brand's conversation volume as a percentage of the total conversation volume for your entire industry or a defined set of competitors. Paired with competitive sentiment analysis, it reveals not just how much people talk about you, but also how their feelings compare to alternatives.
This metric is crucial for understanding your competitive positioning and brand awareness. For example, a tech startup might see its SOV double quarter-over-quarter as its customer base grows, confirming its marketing efforts are gaining traction. Conversely, a stable SOV with declining sentiment compared to rivals could signal a brewing customer service crisis or a competitor's service improvement. Tracking SOV helps you benchmark your brand's presence and perception against those you compete with directly.
How to Calculate and Use SOV
SOV is calculated by tracking your brand mentions against the total mentions for all relevant brands in your competitive landscape. You can then segment this data by sentiment to get a richer, more contextual understanding of your market position.
- Formula:
(Your Brand Mentions / Total Market Mentions) x 100 = % Share of Voice - Target Benchmark: There is no universal benchmark; the goal is typically to achieve a leading or growing SOV within your competitive set. A dominant brand might aim for 50%+, while a challenger may target a steady 5-10% increase each quarter.
Best Practices for Tracking SOV
To track this KPI effectively, you must first precisely define your market and then consistently monitor conversations across relevant channels.
- Define Your Competitors: Carefully select a group of direct competitors. Including irrelevant players will skew your data and lead to flawed insights.
- Track Trends Over Time: Monitor SOV monthly or quarterly to identify whether your share is growing, shrinking, or remaining stable relative to your marketing and service investments.
- Combine with Sentiment: A high SOV is not always positive. Use a tool like ForumScout to compare sentiment scores across competitors. A 30% SOV with 90% positive sentiment is far more valuable than a 50% SOV with 60% negative sentiment.
- Analyse the 'Why': When significant SOV shifts occur, investigate the cause. Was it a competitor's product launch, a PR crisis, or a successful marketing campaign? For a deeper dive, learn more about how to conduct a competitor analysis.
10. Lead Quality Score & Revenue Attribution
Lead Quality Score and Revenue Attribution are advanced customer services KPIs that shift the perception of support from a cost centre to a revenue driver. Lead Quality Score evaluates the potential value of a lead generated or nurtured through a service interaction, while Revenue Attribution connects those interactions directly to closed deals. This powerful combination proves the direct financial impact of a high-quality customer service team.
These metrics are crucial for justifying investment in customer service and understanding its role in the sales funnel. For instance, a B2B SaaS company might discover that prospects who engage with their support team during a trial period are 30% more likely to convert. By tracking these interactions, they can attribute a significant portion of new revenue directly to the support team's efforts, showcasing their value beyond just problem-solving.
How to Calculate and Use Lead Quality & Revenue Attribution
Calculating these metrics involves collaboration between service and sales teams to create a scoring model and a tracking process within your CRM. Lead quality is often scored based on profile fit, engagement level, and behavioural signals.
- Formula (Lead Score):
(Profile Fit Score x Weight) + (Engagement Score x Weight) + (Behaviour Score x Weight) = Total Lead Quality Score - Target Benchmark: Aim to attribute 15-25% of new business revenue to service-influenced leads. A high-quality lead score is typically anything above 80 on a 100-point scale, but this will vary based on your model.
Best Practices for Tracking Lead Quality & Revenue Attribution
To implement this successfully, you need a tight feedback loop between your customer-facing teams and a clear definition of what a qualified lead looks like.
- Establish a Scoring Model: Work with sales to define your ideal customer profile. Assign points based on attributes like company size, industry, and the prospect's engagement level. A common model is Profile Fit (40%), Engagement (30%), and Behaviour (30%).
- Identify High-Intent Prospects: Use a tool like ForumScout to monitor organic conversations on platforms like Reddit and Twitter. When someone expresses a problem that your product solves, that's a high-intent, high-quality lead your service team can engage with.
- Integrate Your CRM: Ensure support agents can tag interactions in the CRM when they assist a prospect. This creates a data trail that connects the service touchpoint to the eventual sale.
- Create a Feedback Loop: Hold monthly meetings between sales and service leaders to review the quality of leads coming from support interactions and refine the scoring criteria. Discuss which touchpoints are proving most influential in closing deals.
Top 10 Customer Service KPI Comparison
| Metric | 🔄 Implementation Complexity | ⚡ Resource Requirements & Efficiency | 📊 Expected Outcomes / Impact | ⭐ Ideal Use Cases / Effectiveness | 💡 Key Advantages / Tips |
|---|---|---|---|---|---|
| Customer Satisfaction Score (CSAT) | Low — single-question surveys; easy to deploy | Low resources; fast feedback collection | Immediate interaction-level satisfaction snapshots; trendable | Post-interaction feedback; support performance monitoring | Quick to implement; combine with qualitative comments; keep surveys very brief |
| Net Promoter Score (NPS) | Low–Medium — single question + follow-up; regular cadence needed | Low collection overhead; needs segmentation and periodic surveying | Predicts loyalty and growth; benchmarkable across industries | Measuring long-term advocacy and customer loyalty | Executive-friendly metric; always include an open follow-up for action |
| Response & Resolution Time (FRT & AHT) | Medium — requires timestamping, integrations, channel rules | Moderate resources; automation improves efficiency; staffing sensitive | Improves perceived responsiveness and operational cost control; exposes bottlenecks | SLA management, time-sensitive social issues, operational monitoring | Use automation/webhooks for timestamps; set channel-specific FRT/AHT targets |
| Customer Effort Score (CES) | Low — short post-resolution survey; needs clear effort definition | Low–Medium; quick to collect but requires follow-up on low scores | Strong predictor of loyalty; reveals friction points in journeys | Process improvement, post-resolution feedback, reducing churn | Ask immediately after resolution; follow up low scores with "what made it difficult?" |
| Response Rate | Low — simple percentage metric; needs clear coverage rules | Low; requires routing and monitoring systems to maintain high rates | Ensures no customers are ignored; indicates monitoring capacity | Social media and multichannel coverage; compliance and trust-building | Set channel targets (e.g., social 95%+); train teams on what counts as a valid response |
| First Contact Resolution (FCR) | Medium — needs clear resolution definition and cross-channel linking | Moderate; requires knowledge base, training, agent empowerment | Reduces repeat contacts and costs; closely tied to customer satisfaction | Technical support, high-volume issue categories, frontline empowerment | Define "resolved" clearly; track by issue type and empower agents to act |
| Customer Retention Rate | Medium — needs cohort tracking and clean customer data | Medium–High; requires analytics, customer success programs | Long-term revenue stability indicator; reflects overall service quality | Subscription/SaaS, loyalty programs, product-market fit evaluation | Segment by cohort; correlate retention with specific program changes |
| Customer Sentiment Analysis & Emotional Tone | High — AI models, tuning, context and cultural training required | High; computational resources, model tuning, ongoing validation | Early issue detection, reputation management, prioritized outreach | Brand monitoring, PR crisis prevention, emotion-based routing | Set baselines and thresholds; combine emotion with volume trends; validate models regularly |
| Share of Voice (SOV) & Competitive Sentiment | Medium — requires defined competitor set and normalization | Moderate; continuous multi-platform monitoring and comparative analysis | Market positioning insight; identifies competitive strengths/weaknesses | Competitive intelligence, campaign benchmarking, market-share signals | Combine SOV with sentiment (volume ≠ positive impact); define competitors carefully |
| Lead Quality Score & Revenue Attribution | High — CRM integration, multi-touch attribution models, cross-team alignment | High; data hygiene, analytics, sales-service processes required | Quantifies support-to-revenue impact; prioritizes high-value leads | B2B sales enablement, revenue ops, proving ROI of support activities | Co-design scoring with sales; use CRM integrations and review models regularly |
Turning Data into Action: Your Next Steps
We've journeyed through ten of the most essential customer services KPI metrics, from foundational scores like CSAT and NPS to more advanced indicators like Customer Sentiment and Share of Voice. Each metric offers a unique lens through which to view your customer interactions, painting a detailed picture of your support team's efficiency, effectiveness, and overall impact on the business. However, the true value of these key performance indicators is not in the data itself, but in the strategic actions it empowers.
The ultimate goal is to move beyond simply tracking numbers on a dashboard. It's about creating a dynamic, data-informed culture where insights are continuously translated into tangible improvements. A dip in your Customer Satisfaction Score isn't just a red flag; it's a specific signal to review recent support tickets or analyse product feedback. A high Customer Effort Score is a direct call to streamline a convoluted returns process or clarify your help documentation.
From Measurement to Mastery: Your Action Plan
Transforming raw data into a strategic asset requires a deliberate and structured approach. The journey from tracking customer services KPI metrics to achieving genuine customer-centricity involves creating a robust feedback loop. This process ensures that what you learn from your customers directly influences how your business evolves.
To get started, follow these actionable steps:
- Prioritise and Focus: Don't try to master all ten KPIs at once. Select three to four that align most closely with your immediate business objectives. If customer loyalty is your top priority, begin with NPS, Customer Retention Rate, and CES. If you're focused on operational efficiency, prioritise First Response Time, Average Handle Time, and First Contact Resolution.
- Establish a Review Cadence: Data is useless if no one looks at it. Schedule regular meetings, whether weekly or bi-weekly, dedicated solely to reviewing your chosen KPIs. This creates accountability and ensures that emerging trends, both positive and negative, are addressed promptly.
- Connect the Dots: Analyse how different KPIs influence one another. For instance, you might discover that a decrease in your First Contact Resolution rate directly corresponds with a drop in your CSAT scores. Identifying these relationships helps you pinpoint root causes and implement more effective solutions.
- Empower Your Team: Share KPI dashboards and insights with your entire customer service team. When agents understand the "why" behind their performance targets, they become more engaged and proactive in finding ways to improve. Celebrate wins publicly and use challenging data as a constructive coaching opportunity.
Key Takeaway: The most successful support teams don't just measure performance; they build a system where customer services KPI insights from metrics like sentiment analysis and FCR are systematically used to refine training programmes, update knowledge bases, and inform product development roadmaps.
The Strategic Value of Proactive Service
By consistently measuring, analysing, and acting on the right data, you transform your customer service function. It evolves from a reactive, cost-centred department into a proactive, strategic powerhouse that actively drives business growth. You begin to anticipate customer needs, mitigate potential issues before they escalate, and uncover opportunities for innovation hidden within everyday customer conversations.
This proactive stance, powered by tools like ForumScout that capture unstructured feedback across social media and forums, is what builds sustainable competitive advantage. It's how you cultivate a loyal customer base that not only stays with you but also becomes a vocal advocate for your brand. Mastering your customer services KPI framework is the first, most critical step on that journey.
Ready to stop guessing and start measuring what your customers are really saying online? ForumScout automates the tracking of crucial KPIs like customer sentiment, response rates, and share of voice by monitoring mentions across Reddit, forums, and social media. Sign up for a free trial of ForumScout today and turn unstructured feedback into your most valuable strategic asset.