
- 17 min read
How to Measure Reach Beyond Simple Follower Counts
To measure reach, you need to count the unique number of people who saw your content across every single channel. The tricky part? You have to carefully remove any audience overlap to avoid counting the same person twice.
It's all about figuring out your total potential audience size, not just blindly adding up follower counts from different platforms. This means gathering data from individual channels and then using smart estimation methods to land on a realistic total.
What Marketing Reach Really Means
Before you can measure reach, you have to get your head around what the metric actually represents. It’s not just some vanity number to flash in a report; it’s the absolute foundation of brand awareness and the first step in building a framework that actually ties back to your business goals.
So many marketers get this wrong. They use "reach" and "impressions" like they're the same thing, but they measure two completely different aspects of your campaign. Getting this distinction right is critical for accurate reporting and, frankly, for knowing what’s actually working.
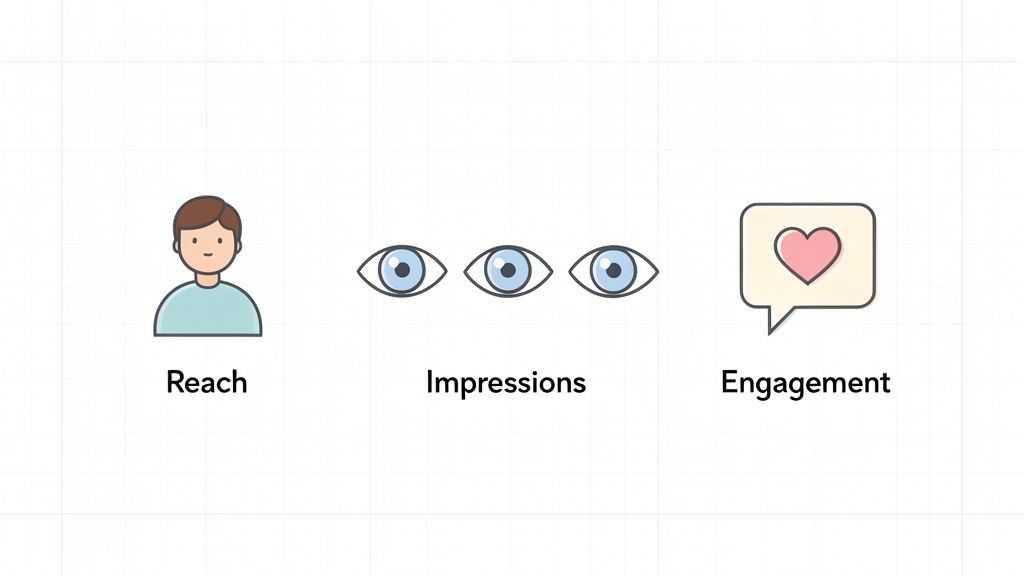
Here’s the simple breakdown:
- Reach is the number of unique individuals who saw your content. If one person sees your post, your reach is one. Simple.
- Impressions count the total number of times your content was displayed on a screen. If that same person sees the post three times, that’s three impressions.
Why This Distinction Matters
Thinking in terms of unique individuals helps you grasp the true breadth of your brand's visibility. Let’s say you’re a startup trying to get noticed. You’d care a lot more about reaching new people (high reach) than showing the same ad over and over to a small, captive audience (high impressions).
To make this crystal clear, here’s a quick table breaking down the core differences.
Reach vs Impressions Key Differences
| Metric | What It Measures | Example Scenario |
|---|---|---|
| Reach | The number of unique people who saw your content. | Your new Instagram ad was seen by 5,000 different users. |
| Impressions | The total number of times your content was shown. | Your ad was displayed 15,000 times, meaning some users saw it 3 times. |
Hopefully, that clears things up. If you're still fuzzy on the details, it's worth taking a moment to understand the fundamental difference between reach, views, and engagement.
This is especially relevant in a market like the UK. As of January 2025, there were 54.8 million social media user identities—that's a staggering 79.0% of the entire population. With that kind of scale, you can't possibly track every mention by hand. It highlights exactly why tools like ForumScout are so essential for keeping an ear to the ground on platforms like Reddit and X.
Ultimately, reach is your starting point. It answers the fundamental question: "How many people are we actually talking to?" Without a clear answer, you can't effectively gauge brand awareness or the success of your top-of-funnel marketing efforts.
Getting a firm grip on reach is the first step towards a holistic view of your audience. If you want to dive deeper into this foundational metric, our guide on how to measure brand awareness provides more context and practical strategies. This knowledge is what sets the stage for moving beyond isolated platform numbers and seeing the bigger picture.
Finding Your Reach Data on Key Platforms
Before you can get that all-important total reach figure, you have to do a bit of legwork and collect the raw data from each channel you’re active on. Every platform has its own analytics dashboard, and honestly, just knowing where to click is half the battle. This isn't about grabbing one vanity number; it's about understanding the specific language each platform uses to talk about visibility.
Let's start with the big social media players. Their built-in analytics are your go-to source for follower-based data. You'll need to pop into each one and pull the numbers for whatever time period you're reporting on.
Social Media Platforms
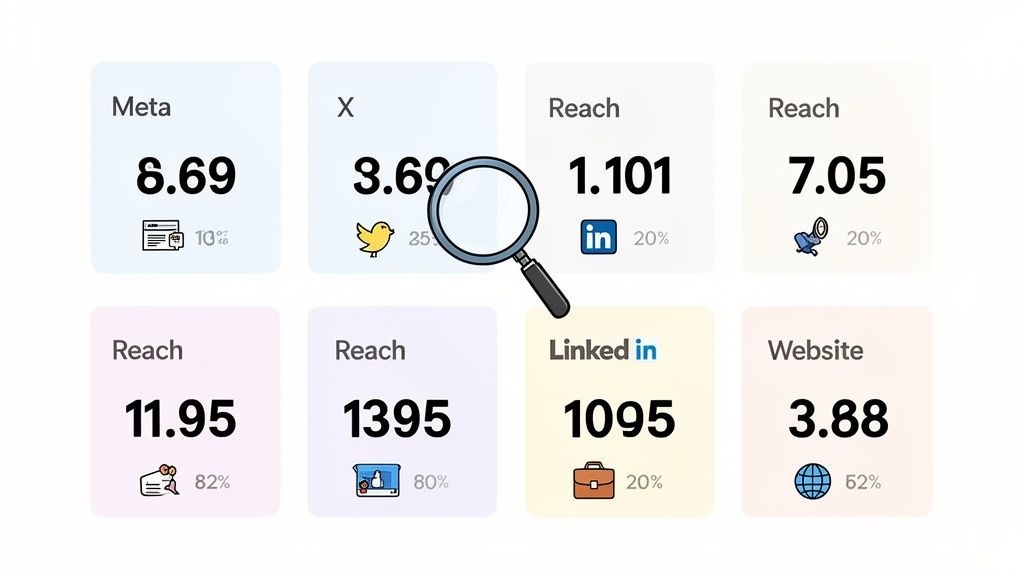
Most of the major platforms make it pretty easy to find your reach data, but they don't always call it the same thing. Here’s a quick rundown of where to look:
Meta (Facebook & Instagram): Your first stop is the Meta Business Suite. Head over to the "Insights" tab, and you'll find Reach for both your Facebook Page and Instagram account. What's really useful here is that Meta breaks it down into organic, paid, and viral reach, which gives you a much clearer idea of what’s actually working.
X (formerly Twitter): When you dive into your account's analytics, the main metric you'll see is Impressions. It’s not a perfect measure of unique reach, but it's the top-level number X gives you for how many times your posts were seen.
LinkedIn: For your Company Page, click into the "Analytics" section. The "Updates" tab will show you impressions for your content, which is the platform's primary metric for exposure.
For any business in the UK, Facebook is still a giant you can't ignore. With a staggering 58.4 million users projected for December 2025, it covers about 84.2% of the entire population. This means that for countless SMEs, Facebook's ad reach metrics—which hit 55.2% of the UK population—are an essential piece of the puzzle. You can discover more UK social media statistics to see just how dominant it is.
Owned Digital Properties
Your brand is more than just its social profiles. Your website and email list are assets you completely control, and their reach is just as critical to measure.
Think of it like this: you're collecting all the individual puzzle pieces first. Only once you have the numbers from each separate channel can you start putting them together to see the bigger picture—your true, deduplicated audience size.
To get that complete view, you'll need to check these sources:
Your Website: Log into Google Analytics (or whatever tool you use). The number you’re looking for is Users or Unique Visitors. This tells you exactly how many different people stopped by your site in a given period, making it the direct equivalent of reach for your website.
Email Marketing: This one's the easiest of the lot. Your email platform, whether it’s Mailchimp or ConvertKit, gives you a clear-cut number: your total number of active subscribers. This figure is the maximum potential reach for any email you send out.
Calculating Your True Cross-Channel Reach
So, you've pulled the raw numbers from each platform. The next logical step seems simple enough: just add them all up, right?
This is easily the biggest—and most common—mistake marketers make. It’s an approach that incorrectly assumes your 10,000 Instagram followers and 5,000 newsletter subscribers are two totally separate groups of people.
In reality, they’re not. A good chunk of your audience likely follows you in multiple places. Just summing up these totals gives you an inflated, inaccurate figure that doesn't reflect the true number of unique individuals your brand is actually connecting with.
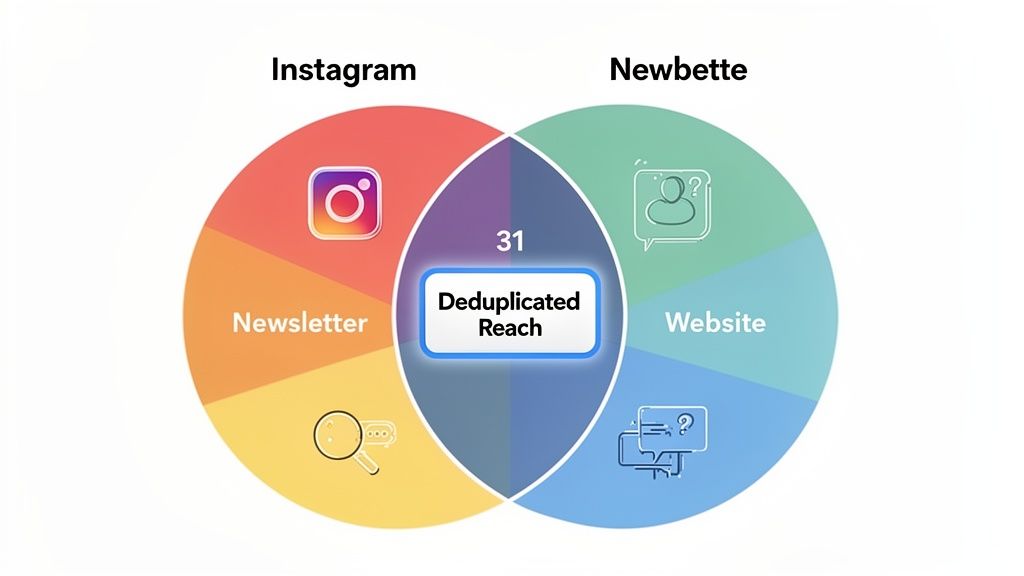
To get a more honest number, you have to account for this overlap. The process of removing these duplicate audience members to find the unique total is called deduplication.
A Practical Method for Estimating Overlap
Let's be realistic: calculating a perfectly precise overlap is nearly impossible without sophisticated and expensive tools. The good news is you don't need perfection. You can create a directionally accurate estimate using a simple sampling method, giving you a reliable benchmark you can track consistently over time.
Let’s walk through a real-world example. Imagine you run a small e-commerce brand selling handmade soaps. Your main channels are Instagram and a weekly email newsletter.
- Start with Your Largest Channel: Your Instagram account has 10,000 followers. This is your baseline.
- Take a Sample from the Second Channel: Your email list has 5,000 subscribers. Export a random sample of 100 subscribers from this list.
- Check for Overlap: Manually check how many of those 100 email subscribers also follow your Instagram account. Let's say you find that 40 of them do.
- Calculate the Overlap Percentage: This gives you an estimated audience overlap of 40%.
- Deduplicate Your Total: Now, apply this percentage to your smaller channel's total audience. Forty percent of your 5,000 email subscribers (2,000 people) are likely already counted in your Instagram followers. This leaves 3,000 unique subscribers on your email list.
- Calculate Your Estimated True Reach: Add the unique audience from your second channel to your primary channel's total: 10,000 (Instagram) + 3,000 (Unique Email) = 13,000 Estimated Total Reach.
This figure is far more realistic than the 15,000 you would get by just adding the two channels together.
This method isn't about achieving mathematical perfection. It's about creating a consistent, logical process to get closer to the truth of your audience size, allowing you to track meaningful growth over time.
Uncovering Your Earned and Potential Reach
Your brand's influence doesn't stop with the people who directly follow you. It extends into countless online conversations happening on platforms you don’t own or control. This is your earned reach—the visibility you gain from word-of-mouth mentions on forums, blogs, and social media.
This is where social listening tools become invaluable. A platform like ForumScout constantly scans places like Reddit, X, and news sites for mentions of your brand. By tracking these conversations, you can estimate the potential audience of the people discussing your products, giving you a powerful proxy for brand awareness.
This data adds another critical layer to your calculations. It helps you understand your brand's true footprint in the wider digital world, which is a key component of your overall share of voice. To learn more, you can check out our guide on effective share of voice measurement. Combining owned channel data with earned media insights gives you the most complete picture of how many people your brand truly reaches.
Using Social Listening to Uncover Potential Reach
Your analytics dashboards only tell part of the story. Real reach lives beyond your owned social profiles, thriving in every unlinked mention, forum thread, and news article where people are actually talking about you. This is your potential reach — a goldmine of organic word-of-mouth that most marketers completely miss.
Trying to quantify this hidden audience with native analytics alone is impossible. You need to look broader. Social listening tools are built for exactly this, scanning millions of digital sources to catch brand mentions you’d otherwise never see. It’s the only way to get a true, real-world perspective on your market presence.
Tapping into Unfiltered Brand Conversations
Social listening platforms like ForumScout are always on, continuously scanning places like Reddit, X, niche forums, and news sites for specific keywords. You can set up tracking for your brand name, products, or even your competitors to see where and how people are talking. Our guide on what is social listening digs a lot deeper into how this all works.
With the right filters, you can isolate the conversations that matter and start to understand the potential audience size of those discussions. This isn't just about counting mentions; it's about seeing the context and the cumulative audience of the platforms where these conversations are happening organically.
This dashboard from ForumScout, for example, shows how mentions can be tracked across all sorts of different sources over time.
The real insight here is seeing the volume of chatter from places like Reddit or news sites. These are audiences you might not be targeting directly, but you're definitely reaching them.
In the UK's crowded social scene, this kind of multi-platform view is non-negotiable. To measure reach properly, you have to remember the average user spends over 16 hours a week spread across 6.2 different platforms. YouTube alone reaches 54.8 million users. With 55.5 million social media identities across the country, tools that can cut through the noise are indispensable. They help you calculate your true share-of-voice and spot where competitors are getting talked about. You can discover more about the latest UK digital trends to get a better feel for this landscape.
Potential reach provides a powerful proxy for brand awareness and share of voice. It shows you how organic, word-of-mouth conversations contribute to your market presence, giving you a more complete picture of your brand's footprint.
Ultimately, tracking these unprompted mentions lets you connect the dots between your owned media efforts and their real-world impact. It helps answer a simple but crucial question: are people talking about us even when we're not in the room? For any marketer serious about how to measure reach, the answer is a critical piece of the puzzle.
How to Report Reach Metrics That Drive Strategy
Let's be honest, raw data is just noise. A spreadsheet crammed with numbers from different platforms doesn't mean a thing until you wrap it in context and tell a story that actually helps the business make smarter decisions. The last, and most important, step in measuring reach is turning your findings into a clear, actionable report.

A truly great reach report is more than just a static monthly snapshot. It needs to visualise trends over time, painting a clear picture of your brand's growing visibility and momentum. It's this narrative that helps stakeholders finally grasp the real value of your marketing efforts.
From Data Points to Strategic Insights
The whole point is to connect your reach metrics directly to business outcomes. To really drive strategy with your data, you need to master your social media Key Performance Indicators, and that absolutely includes reach. Don’t just state that your reach jumped by 10%; you need to explain why it happened and what it actually means for the business.
This is where segmenting your data comes in. It helps you uncover much deeper insights and pinpoint exactly what’s resonating with different pockets of your audience.
- By Channel: Which platforms are giving you the most bang for your buck in expanding your audience? Is your investment in LinkedIn actually delivering a higher unique reach compared to X?
- By Campaign: Did that big summer product launch successfully connect with a new demographic? Compare its reach to your baseline numbers to see its specific impact.
- By Persona: If you tailor content for different customer personas, segmenting your reach will show you which group is most engaged and where your next big growth opportunities are hiding.
This level of detail is what transforms a generic report into a powerful diagnostic tool.
Adding Context with Competitive Benchmarking
Your reach doesn't exist in a vacuum. A 20% month-over-month increase might sound fantastic, but what if your main competitor shot up by 40% in the same timeframe? Context is everything.
A reach report isn't just about looking inward at your own performance. It's about understanding your brand's position within the wider market conversation. Without this external context, your data lacks strategic meaning.
Tools like ForumScout are perfect for this. By keeping an eye on mentions of both your brand and your competitors, you can calculate your share of voice—basically, what percentage of the industry conversation belongs to you. Weaving share of voice into your reports gives you a clear benchmark for your performance and shines a light on where you can capture more market attention.
Building a Report That Gets Read
Finally, presentation matters. A lot. No one wants to squint at a dense spreadsheet or wade through a wall of text. Your report should be visual, concise, and focused on the insights—not just the raw numbers.
A simple dashboard format is often your best bet. Here’s a sample structure you can use as a template for your own reporting.
Sample Cross-Channel Reach Dashboard
This table offers a clear, at-a-glance view of your monthly performance, making it easy for stakeholders to spot trends and understand the story behind the data.
| Channel | Key Metric | Current Month | Previous Month | Month-Over-Month Change | Key Insights |
|---|---|---|---|---|---|
| Unique Reach | 150,000 | 135,000 | +11.1% | New Reels strategy drove significant new audience growth. | |
| Impressions | 85,000 | 92,000 | -7.6% | Decreased post frequency led to lower visibility this month. | |
| Subscribers | 22,500 | 21,800 | +3.2% | Lead magnet campaign successfully added 700 new subscribers. | |
| Website | Unique Visitors | 45,000 | 42,000 | +7.1% | SEO improvements on key blog posts are paying off. |
| Share of Voice | Brand Mentions | 2,100 | 1,800 | +16.7% | Our summer campaign generated more industry buzz than competitors. |
By structuring your report this way, you move beyond just listing numbers. You provide context, trends, and the "why" behind the performance. This transforms your report from a simple data dump into a strategic asset that proves marketing's value and confidently guides your next move.
Common Questions About Measuring Reach
As you start getting serious about measuring reach, a few questions always seem to pop up. Moving from simple follower counts to a more nuanced view of your audience can feel complex, but the answers are usually pretty straightforward.
Let's walk through the most common ones I hear from teams making this shift.
What Is the Difference Between Reach and Impressions?
This is the big one, and getting it right is crucial for everything that follows. I like to keep it simple.
Reach is the number of unique people who saw your content. If 100 individuals see your post, your reach is 100. It’s the total size of the audience you managed to get in front of.
Impressions are the total number of times your content was displayed. If those 100 people each saw your post twice, you'd have 200 impressions. This metric isn't about audience size; it’s about exposure frequency.
So, when does each one matter? If you're running a brand awareness campaign, reach is your north star. But if you’re trying to reinforce a specific message, impressions become more valuable.
How Often Should I Measure and Report on Reach?
Consistency is far more important than frequency here, but having a standard cadence helps you spot trends that actually mean something.
For most businesses, a monthly reporting cycle is the sweet spot. It’s frequent enough to track progress and make adjustments, but not so often that you get lost in the noise of daily algorithmic mood swings.
That said, for specific, time-sensitive campaigns—like a product launch or a major event—you should absolutely be tracking reach weekly, or even daily. This lets you pivot fast if a channel isn't pulling its weight. The goal is to build a reliable historical dataset to benchmark against.
Why Is My Organic Reach on Social Media Declining?
If you've noticed your organic reach dropping, you're not alone. It's a widespread headache, especially on mature platforms like Instagram and Facebook. In fact, some research shows that Instagram's average reach rate has seen a 12% year-over-year decrease.
There are two main culprits behind this trend:
- Algorithm Changes: The platforms are constantly tweaking their algorithms. More often than not, these changes prioritise content from friends and family or posts with ridiculously high engagement, pushing brand content down the feed.
- Increased Competition: It's just more crowded out there. An unbelievable amount of content is being published every single day, making it that much harder to capture attention organically.
To fight back, your best bet is creating content that sparks genuine conversation. Experiment with engaging formats like short-form video and seriously consider allocating a paid budget to boost your most important messages. Sometimes you just have to pay to play.
Is It Possible to Calculate a 100% Accurate Total Reach?
In a word? No. It’s important to accept that calculating a perfectly deduplicated reach across every single online and offline channel is practically impossible without a massive budget and a team of data scientists.
The real goal isn't mathematical perfection but a directionally accurate estimate. Use the sampling and modelling techniques we've discussed to create a reliable benchmark. A consistent methodology allows you to track growth over time with confidence, which is far more valuable than chasing an unattainable, perfect number.
Ready to uncover the conversations that define your true potential reach? ForumScout monitors millions of sources across Reddit, X, news sites, and forums to catch every mention of your brand. Start your free 7-day trial and see what you've been missing.